1 June 2015
LUNÄ: Joseph Priestley: The Man Who Drew Time
text by Stephen Boyd Davis
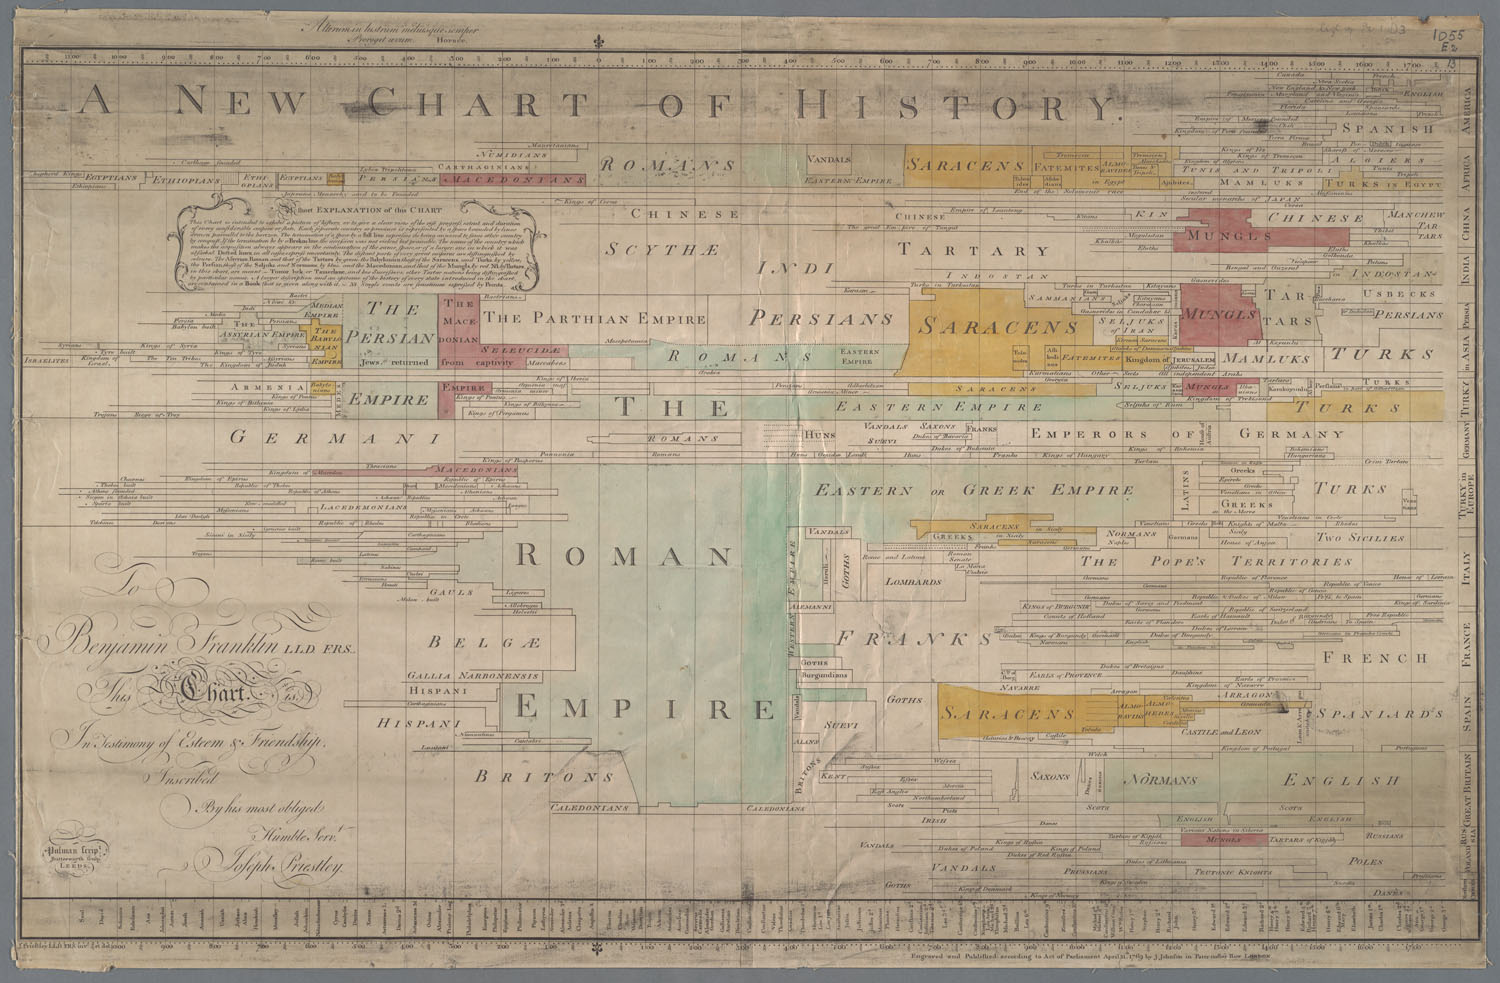
Introduction to 'A New Chart of History' made by Lunar Man Joseph Priestly in 1765 and 1769, who developed the first linear timeline of history as we now commonly know. At the LUNÄ Talks in London in fig-2, Stephen introduced some of the interpretations by Joseph Priestley in relation to the session 'Time and Progress'.
Author: Stephen Boyd Davis is Professor of Design Research at the Royal College of Art, UK. He specializes in visual and spatial representation.
Further reading:
History of the Timeline, by Stephen Boyd Davis
Chronographics, a blog by Stephen
Context: These LUNÄ talks are developed by Marjolijn Dijkman in collaboration with Fig. 2. LUNÄ is a work by Marjolijn Dijkman based on the Lunar Society of Birmingham. The Lunar Society of Birmingham was formed from a group of amateur experimenters, tradesmen and artisans who met and made friends in the Midlands in the 1760s. Members included the flamboyant entrepreneur Matthew Boulton, the brilliantly perceptive engineer James Watt whose inventions harnessed the power of steam, the radical polymath Joseph Priestley who, among his wide-ranging achievements discovered oxygen, and the innovative potter and social reformer Josiah Wedgwood. Their debates brought together philosophy, arts, science and commerce, and as well as debating and discovering, the ‘Lunarticks’ also built canals and factories, launched balloons, named plants, gases and minerals, managed world-class businesses — and changed the face of England.
Three centuries later, Dijkman revisits this moment of historical significance. She produces the replica of the table where Lunar Men met, in order to provide a platform to develop and expand on the knowledge production of our times. At fig-2, she will specifically focus on the notion of the future investigating modes in which the idea of future is seeded in our society today.
fig-2 – 50 projects in 50 weeks
fig-2 is a revival of the project fig-1, which was conceived and developed by Mark Francis and Jay Jopling in 2000. Experimental in its nature, each project was programmed only a few weeks in advance to maintain as much spontaneity as possible. fig-1 presented projects by Jeremy Deller, Richard Hamilton, Runa Islam, Oliver Payne + Nick Relph, Will Self, Patti Smith, Caruso St. John, Philip Treacy, among others. Fifteen years later, fig-2 brings together a programme that is driven by the radical imagination of artists, writers, dancers, architects, and designers curated by Fatos Ustek.
Close-up of 'A New Chart of History', Joseph Priestly
A version of this article first appeared in the newsletter of the Joseph Priestley House, Northumberland, Pennsylvania in 2011. It is reproduced here by kind permission.
Priestley may be familiar to readers of this newsletter as educator, chemist, and electrician, and as a religious and political radical, but there is yet another side to this multi-faceted figure. He was a pioneering information designer who helped invent modern visualization. While pictures represent something we can already see, visualization takes something which we cannot see – such as Time – and makes a diagram of it. Seeing charts and timelines every day, we take visualization for granted, but these things had to be invented, and Priestley realized how charts could help us to understand and remember complex information: our brains respond to information in this form in a quite different way to when we read words. As so often, necessity was the mother of invention: teaching history at the Warrington Dissenting Academy, Priestley needed to make sense of the lives of historical figures. He started to draw diagrams of time, with the life of each individual marked in its appropriate place. In his Description of a Chart of Biography of 1764 he explains the advantages, with the example of trying to figure out the relationship between the lives of five historical figures. He tells his reader the dates of their deaths and how old they were when they died and then asks a number of questions about the relation between their lives. We soon realize how hard this is, until the Chart comes to our rescue. Priestley explains: ‘as soon as you have found the names, you see at one glance, without the help of Arithmetic, or even of words, and in the most clear and perfect manner possible, the relation of these lives to one another.’ This is the essence of visualization – to show relationships and patterns in information.
Who invented the timeline?
Did Priestley invent the timeline? He did, but so did someone else a little earlier. The Frenchman Jacques Barbeu-Dubourg (1709-1779) seems to have been the first to lay out time as a true diagram. Everyone before him had used some sort of list or table, but instead he measured equal numbers of years using equal lengths of paper. His chart of 1753 represents all time from the Creation to his own days. Like Priestley, Barbeu-Dubourg had strong links with the American states, sympathizing with the revolt against British rule. Both corresponded with Benjamin Franklin, and at one point Barbeu-Dubourg thanks Franklin for sending him a Priestley chart: ‘I have received with gratitude and viewed with pleasure the biographical chart of Mr. Priestley which is in truth made on almost the same principles as my own – without plagiarism on either side, as I in no way claim primacy on account of the date.’ Sadly, Barbeu-Dubourg lost all his money in his attempts to supply French arms to the American Revolution.
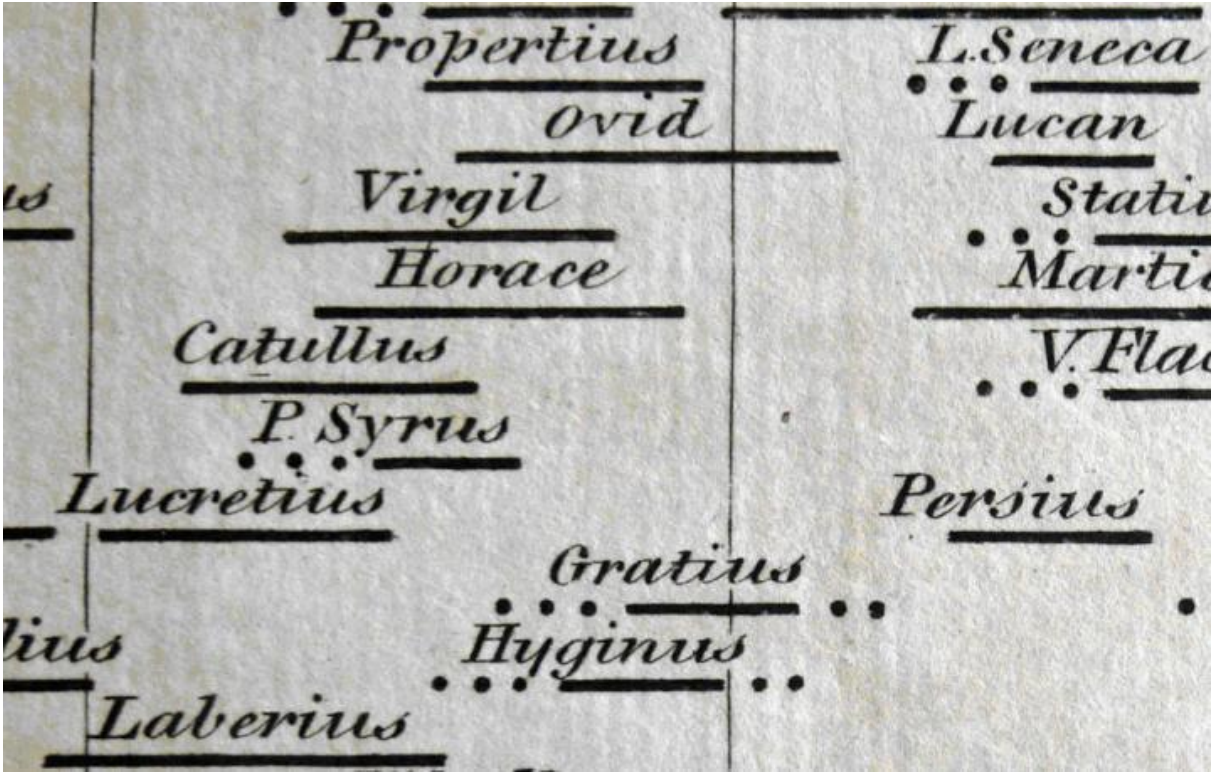
Lines for lives and dots for doubts
Though Priestley may not have invented the timeline as such, there are two striking innovations that he certainly did make. The French chart gives only the roughest indication of the life of each individual. For example, looking at the the French chart in detail, we might try to determine when Locke was born and when he died. But we cannot tell: his name on Barbeu-Dubourg’s chart (plus the little icon of spectacles that represents philosophers and wise men) extends from 1700 to 1705; but Locke lived from 1632 to 1704. Priestley instead drew a line for each life, extending the idea of the timeline for history to individuals, ‘the length of whose lives is here represented by lines drawn in proportion to their real duration, and terminated in such a manner as to correspond to the dates of their births and deaths in universal time.’ Having invented the idea of using a line to represent duration, Priestley was clever enough, and subtle enough, to realize that he had a new problem. A line is a definite thing, but historical dates often are not. Suppose we do not know exactly when someone was born or died? As the detail of Priestley’s chart shows, he had a solution: ‘The method I have used in this chart is to express certainty by a full line, and what is uncertain by dots or a broken line.’ In fact he graded uncertainty into five levels using different numbers of dots. Perhaps surprisingly, very few timelines since Priestley’s day have bothered with this kind of subtlety. Priestley was honest enough to realize, in the earliest days of visualization, that diagrams can be misleading, and was determined to make sure he gave a true picture of what was known for certain and what was not. Priestley’s approach was enthusiastically adopted by others, especially by William Playfair (1759–1823) who went on to develop the statistical line graph, bar chart, and pie chart. Priestley himself summed up what can be achieved by visualization: ‘what words would do but very imperfectly, and in a long time, this method effects in the compleatest manner possible, and almost at a single glance.’
Click to see enlargements
The New Chart of Biography (1765) (as published in 'Cartographies of Time'):
The New Chart of History also by Priestley (1769):